
Big Block Diffusion and Organic Big Blocks on Ethereum


As mentioned in our previous post, Codex is working on research around data availability sampling (DAS) for Ethereum scaling. Part of this research is to develop a simulator that can give us some good estimates about how much time it takes to disseminate a huge block of 128 MB (including erasure-coded data) to the entire network. The simulator is already producing great results, but that will be a matter of a future post. In this article, we want to focus on two by-products of this research: the characterisation of big block diffusion latency on the existing Ethereum Mainnet and the existence of big organic blocks on Ethereum Mainnet and its implications.
Inflating Blocks Artificially
Every simulator needs to be evaluated, at least partially, with a real-world measurement that demonstrates that the results produced by the simulator are accurate. To validate our simulator, we started looking at the data produced by an experiment done by the Ethereum Foundation (EF). The experiment was done on May 28th and June 11th and consisted of injecting big blocks in Ethereum Mainnet. The target block sizes were in a range from 128 KB to 1 MB. The blocks were artificially inflated by adding random bytes using CALLDATA to them through a steady stream of 64 KB transactions. As a reference, the average block size in Ethereum is 100 KB. The objective was to measure the arrival of those big blocks in multiple nodes located in different world regions. More precisely, the EF deployed 15 nodes, called Sentry nodes, in three different continents, the exact locations are: Sydney, Amsterdam and San Francisco, to observe the impact of network latency on attestations and block propagation. The Sentry nodes were all running Xatu, a network monitoring and data pipelining tool. Each location had five nodes running, one for each consensus layer (CL) client: Prysm, Lighthouse, Teku, Nimbus and Lodestar. The exact versions used for each client are described in the following table.
| Client | Version |
| Prysm | develop-f1b88d0 |
| Lighthouse | stable-7c0b275 |
| Teku | master-fccbaf1 |
| Nimbus | stable-748be8b |
| Lodestar | unstable-375d660 |
Stumble on Organic Big Blocks
At the same time this DAS research was ongoing, the team at MigaLabs was analysing block sizes and the number of transactions per block, among other data points. By looking at block sizes outside the experiment dates, we discovered that there were many big blocks in the Ethereum Mainnet. After confirming with the EF researchers that those blocks were not artificially inflated, we started looking at how frequent these organic big blocks are. Over the last six months, from March 1st 2023 to August 31st 2023, we have found a total of 109,504 blocks with a size over 250 KB, which is about 8.2% of the 1,323,034 slots in that time period. The biggest block (#17968783) observed during those six months was produced on August 22nd, and it had a size of 2.3 MB, which was very surprising. The maximum gas used in a block is 30,000,000, and the CALLDATA cost is 16 gas per byte, which should lead to a maximum block size of roughly 1.8 MB. However, 16 gas per byte is the cost for non-zero bytes, while zero bytes have a cost of 4 gas. This means that blocks with a large number of zeros in CALLDATA can go over 1.8 MB and in theory, one could even create a block of over 7 MB.
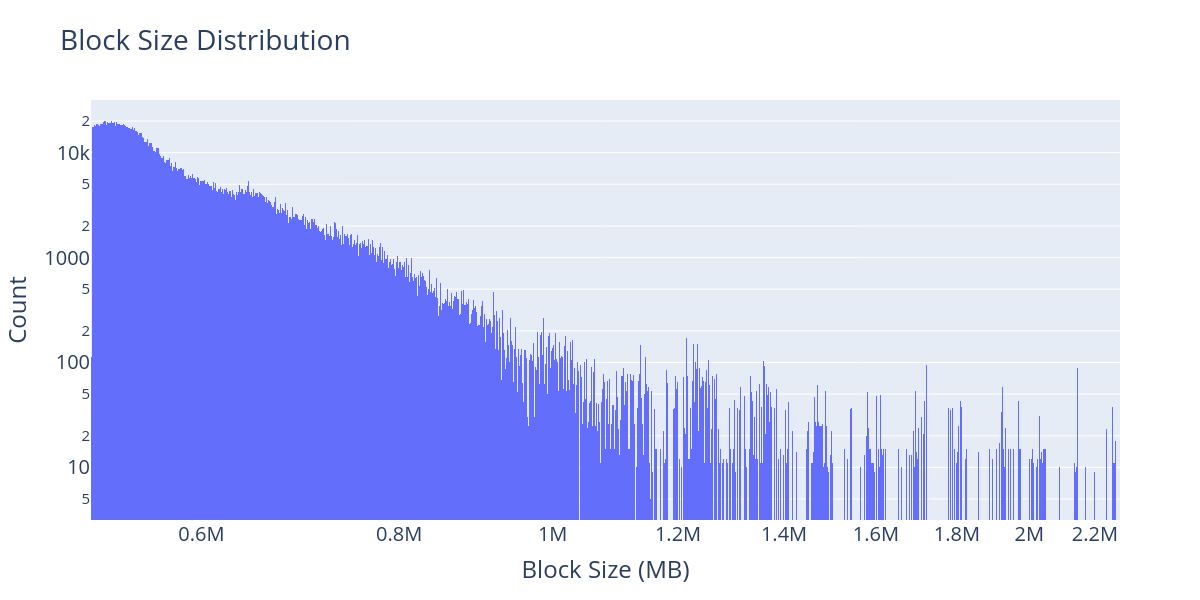
The figure above presents the distribution of blocks over 250 KB from March 1st to August 31st; note that we use a logarithmic scale in the y-axis. During those six months, the 15 Sentry nodes were running and recording the exact time blocks were received. That allowed us to do a detailed analysis of the block propagation times depending on their size and geographical location from the perspective of different CL clients.
Impact of Geographical Location
We analyse the time when the block is reported in the three different locations. Note that the three regions are located almost perfectly at 8 hours difference from each other. According to monitorEth, most Ethereum nodes are located in North America, Europe and Asia, giving Europe a central location in the network. The following figure shows the cumulative distribution function (CDF) of the latency in milliseconds for all the blocks over 250 KB as observed by the Lighthouse nodes, for the three different locations.
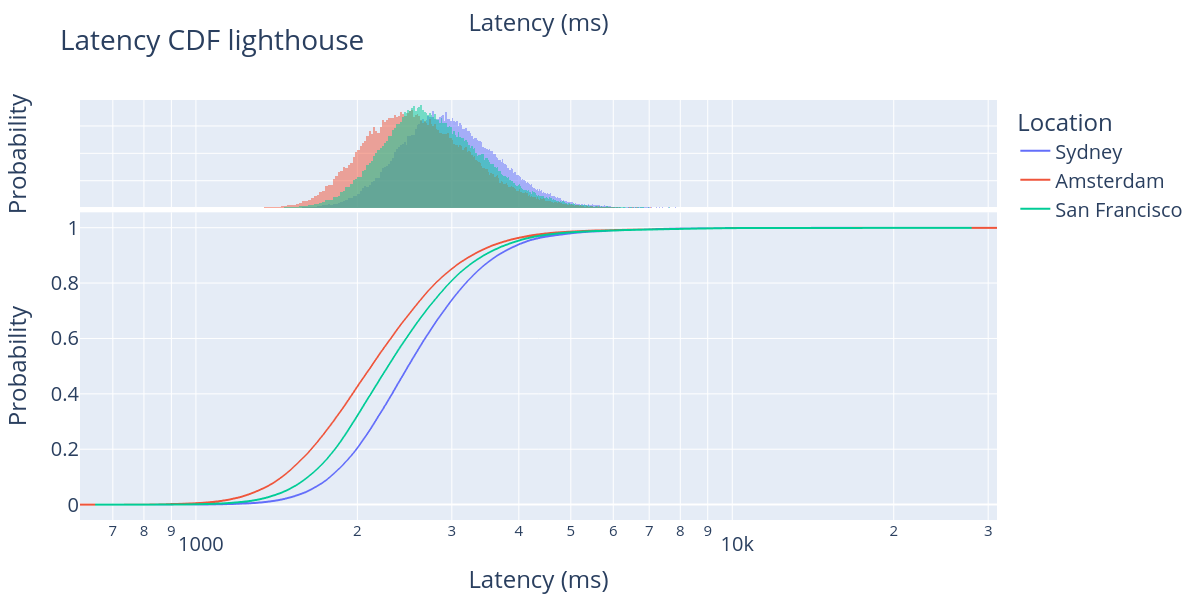
As we can observe in the figure, the large majority of the blocks arrive between 1 and 4 seconds after the beginning of the slot for all three regions. However, the mean arrival time differs by about 400ms between Amsterdam and Sydney, while San Francisco sits between them at approximately 200ms distance to both. While this difference is not dramatic, a couple of hundred milliseconds do have a non-negligible impact on the node performance, particularly when nodes are under tight deadlines to produce blocks, send attestations and disseminate aggregations. We produced similar figures for the other CL clients, and they show similar results.
Block Size Dissemination Times
For the DAS research we are doing at Codex, the most exciting result of this discovery is to analyse the propagation time of big blocks in the network. Thus, we took the 100K+ big organic blocks that we found and divided them into bins of 250 KB, starting from a range from 250 KB to 500 KB, the second one from 500 KB to 750 KB, and so on until the last range going from 2000 KB to 2250 KB.
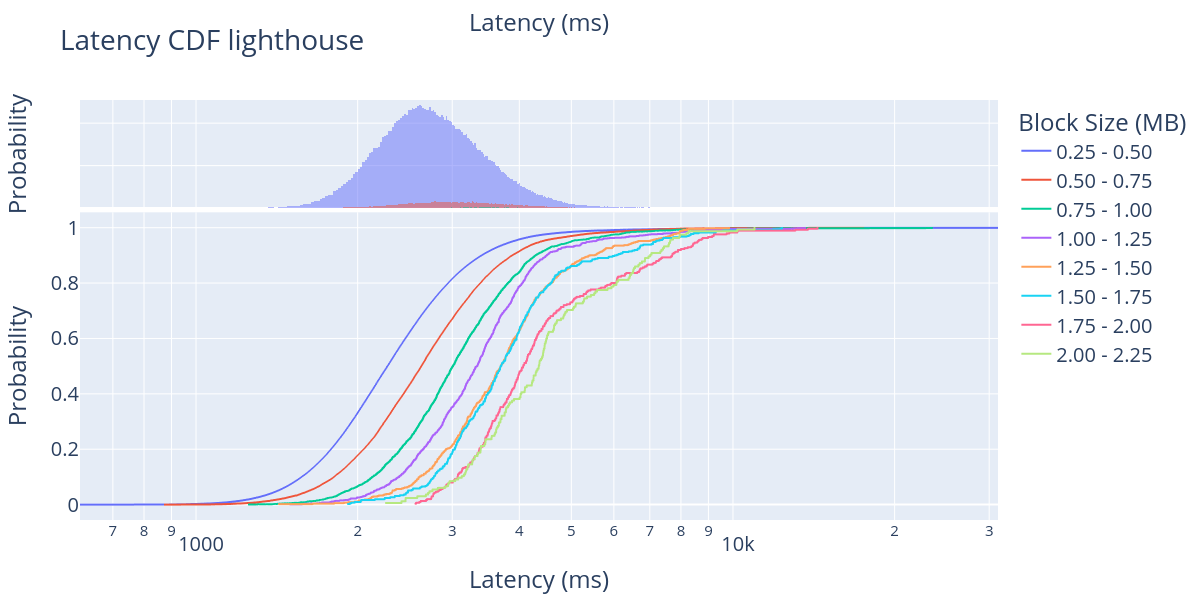
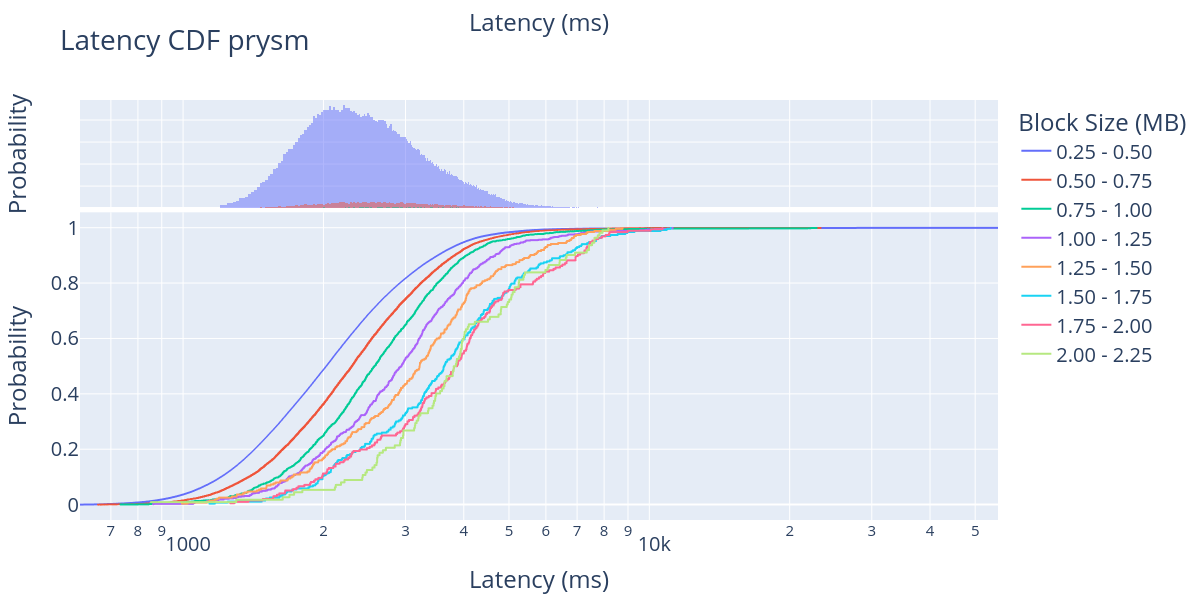
We also divide the data of the different CL clients because they report blocks at different moments in the block treatment pipeline, some as soon as they receive it in the p2p network layer (libp2p/GossipSub), some batch multiple network events before treating them, while others report only after the block is fully imported (EL, CL validated and inserted into the block DAG). In other words, our intention here is not to compare the latency of different CL clients. We can’t do that based on the data available currently. To the contrary, we should only compare oranges with oranges and treat different CL results as insight into the timing of other parts of the processing pipeline. Here, we show the results for all five CL clients separately.
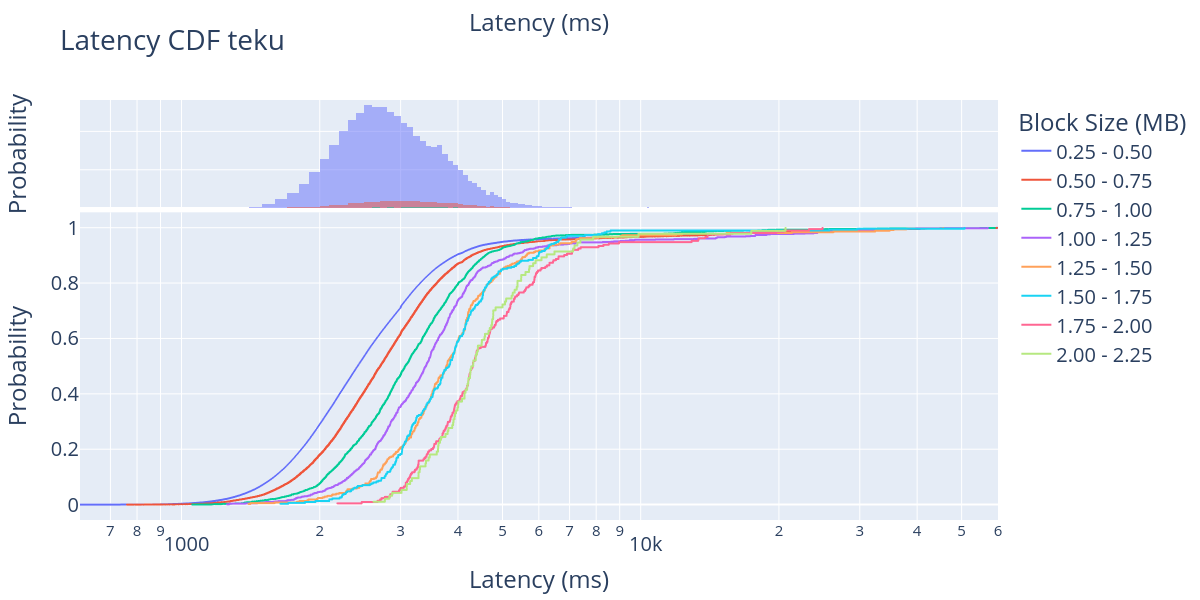
For each CL client, we plotted both the CDF (bottom) and the probability distribution function (PDF) (top) of the block propagation latency for different block sizes. Note that the x-axis is logarithmic, starting from 600 ms up to 60,000 ms in some figures. One thing that we observe very clearly in the PDF is that the large majority of the blocks shown in these figures are blocks in the first size range (250 KB - 500 KB). This agrees with the data presented in the block size distribution figure.
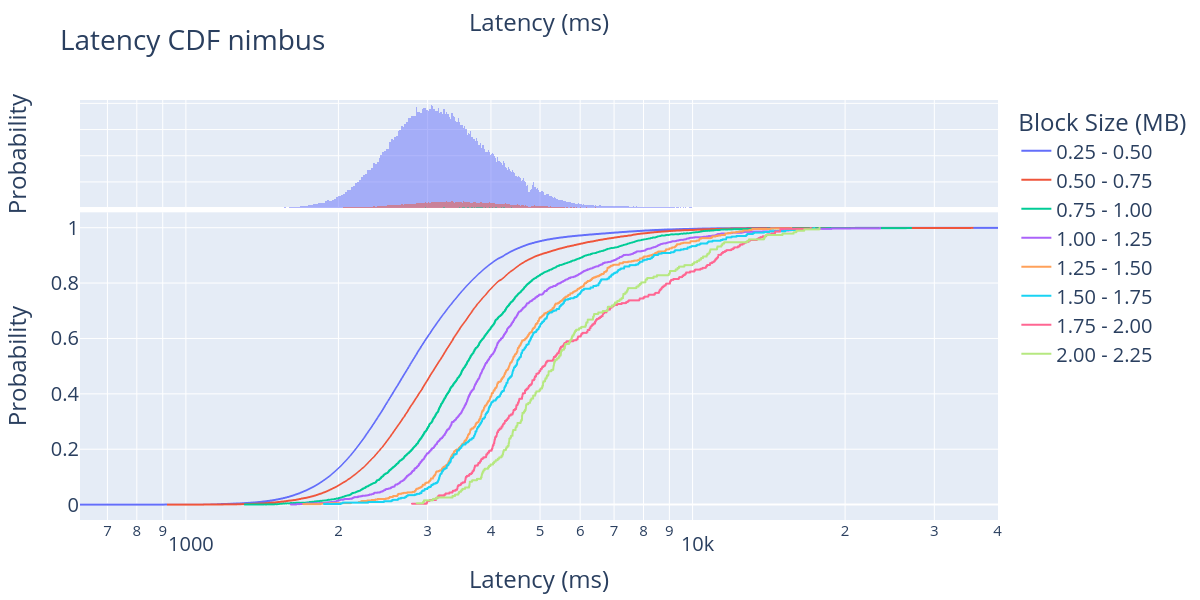
Looking at the CDF, it is clear that the large majority of big blocks are reported between 1 and 8 seconds after the beginning of the slot, except for a few clients that actually report the block after some computationally intensive processing. We also see a clear trend in which bigger blocks take more time to propagate through the network, which is to be expected. However, the distance between block sizes is extremely hard to predict in a p2p network with more than 10,000 nodes distributed worldwide and five different implementations with different optimisation strategies.
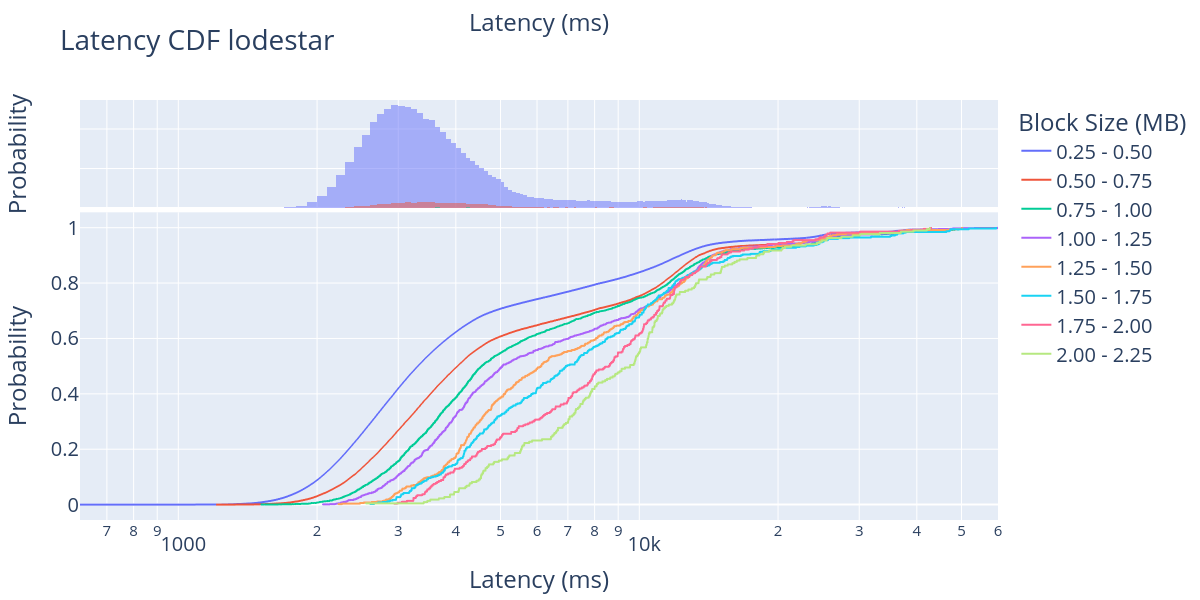
In these results, we can see that there is a 2-second delay between the 250 KB blocks and the 2250 KB blocks. For instance, looking at the block arrival time for Lighthouse, we can observe that 40% of the blocks in the 250 KB - 500 KB size range have arrived in about 2 seconds, while 40% of the blocks in the 2000 KB - 2250 KB size range arrive in about 4 seconds from the start of the slot.
Similarly, looking at Prysm’s 80% line, we can observe the block arrival time shifting from 3 seconds to about 5 seconds, from 250KB to 2000 KB. Overall, these results show that the current Ethereum network can manage to accommodate large blocks from 1 MB and up to 2 MB. This is good news for the upcoming EIP-4844, in which we expect to add blobs of rollup data and the average block size is expected to be around 1 MB.
Conclusions
We have discovered a large number of big blocks (>250 KB) that occur organically every day in the Ethereum Mainnet. We have measured the propagation time of those blocks in three different world regions and compared their latency based on geographical location as well as block size. We have analysed how these propagation differences are reflected in the five CL clients separately, as they have different ways of reporting blocks. The empirical results measured in Ethereum Mainnet and presented in this work give us the first clear idea of how block propagation times might look when EIP-4844 is deployed, and 1 MB blocks become the standard and not the exception.
In the future, we plan to continue with these block propagation measurements and monitor the behaviour of big blocks in the Ethereum network. Additionally, we want to help different CL clients harmonise their event recording and publication systems in order to be able to compare CL clients between them.
Acknowledgements
This analysis was done by Csaba Kiraly and Leonardo Bautista-Gomez, with the support and feedback from Dmitry Ryajov, Dankrad Feist, Danny Ryan, Andrew Davis, and Sam Calder-Mason.